Example action plan · Aircraft maintenance
A full order book.
A plan to restore capacity.
Orders are coming in, but lead times are increasing and margins shrinking. Here is how 230 interviews inform three priority workstreams and five proposed decisions for the executive team.
251
People invited, across three sites and all functions
230
Interviews in three days · ≈92% participation
187
Improvement suggestions
23
Commercial opportunities identified
AT A GLANCE
Three workstreams.
Five decisions to make.
The plan builds on four strengths to preserve: technical expertise, a strong safety culture, responsiveness in emergencies and commitment to the profession.
1
Give certified mechanics more time for hands-on work
Prepare maintenance checks, deliver parts to the workstation and consolidate access to documentation.
≈ €700k/year
2
Remove the post-inspection quoting bottleneck
Record findings once, segment the quote queue and delegate approval thresholds.
≈ €260k/year
3
Share one view of capacity
Have planning approve dates before any commitment to the customer.
≈ €180k/year
These estimates total around €1.14m/year.
Effects on capacity, lead times and retention are not added to these amounts. Conservative estimates of expected annual gains once fully implemented.
Five proposed decisions for the executive team
Appoint one owner for maintenance check preparation.
Segment the quote queue and delegate approval thresholds.
Require planning approval before any date commitment, from week one.
Place the data and AI roadmap under the authority of the airworthiness function.
Choose the first opportunity to prototype within 90 days.
01 — THE CONTEXT
A full order book.
Capacity slipping away.
This aircraft maintenance business has invested in tools, hired technicians and extended its approvals. Yet lead times are increasing despite a full order book. Leadership wants to understand what is consuming capacity and which changes could restore it.
The interviews cover around 92% of the agreed scope, with a median of 41 conversational turns. They provide an in-depth view of internal operations. The evidence remains self-reported: customers’ views are known only through the teams, and estimates must be checked against company data.
02 — THE EXECUTIVE DECISION BRIEF · FIVE PAGES TO SUPPORT DECISIONS
What an executive team receives
to make decisions.
The executive decision brief brings together the strengths to preserve, causes of bottlenecks, estimated costs and proposed decisions. It distinguishes expected gains from effects still to be measured. The report details the findings and calculations behind them.
1. What works
The interviews identify four strengths: technical expertise, safety embedded in daily practice, responsiveness in emergencies and commitment to the profession. The plan builds on these strengths to address organisational bottlenecks.
2. What holds the business back, and what it costs
The direct cost of friction is conservatively estimated at around €2.1m/year, after removing double counting. Each finding is summarised here and examined in section 3.
≈ €1.25m/year
Certified mechanics’ time is fragmented: ≈ €1.25m/year. Interviewed technicians estimate that only around a third of their day is spent on hands-on work. The theme appears in 148 of the 230 interviews. “I spend more time finding the right page than removing the part.” (an airframe technician)
≈ €480k/year
Post-inspection quoting holds up the process: ≈ €480k/year. A finding absent from the stated priorities: each inspection finding must be costed before the operator approves the work, and this quote queue depends on just two people. While the quote is pending, the aircraft occupies a hangar slot without productive work taking place (74 interviews). “When I am on leave, the queue stops. I know it; everyone knows it.” (a member of the estimating team)
≈ €370k/year
Sales and the hangar work from different views of capacity: ≈ €370k/year. Sales commits to return-to-service dates based on theoretical bay capacity, without planning approval. The hangar absorbs the actual workload through overtime and rescheduling (89 interviews). “We sell hangar weeks we do not have.” (a planner)
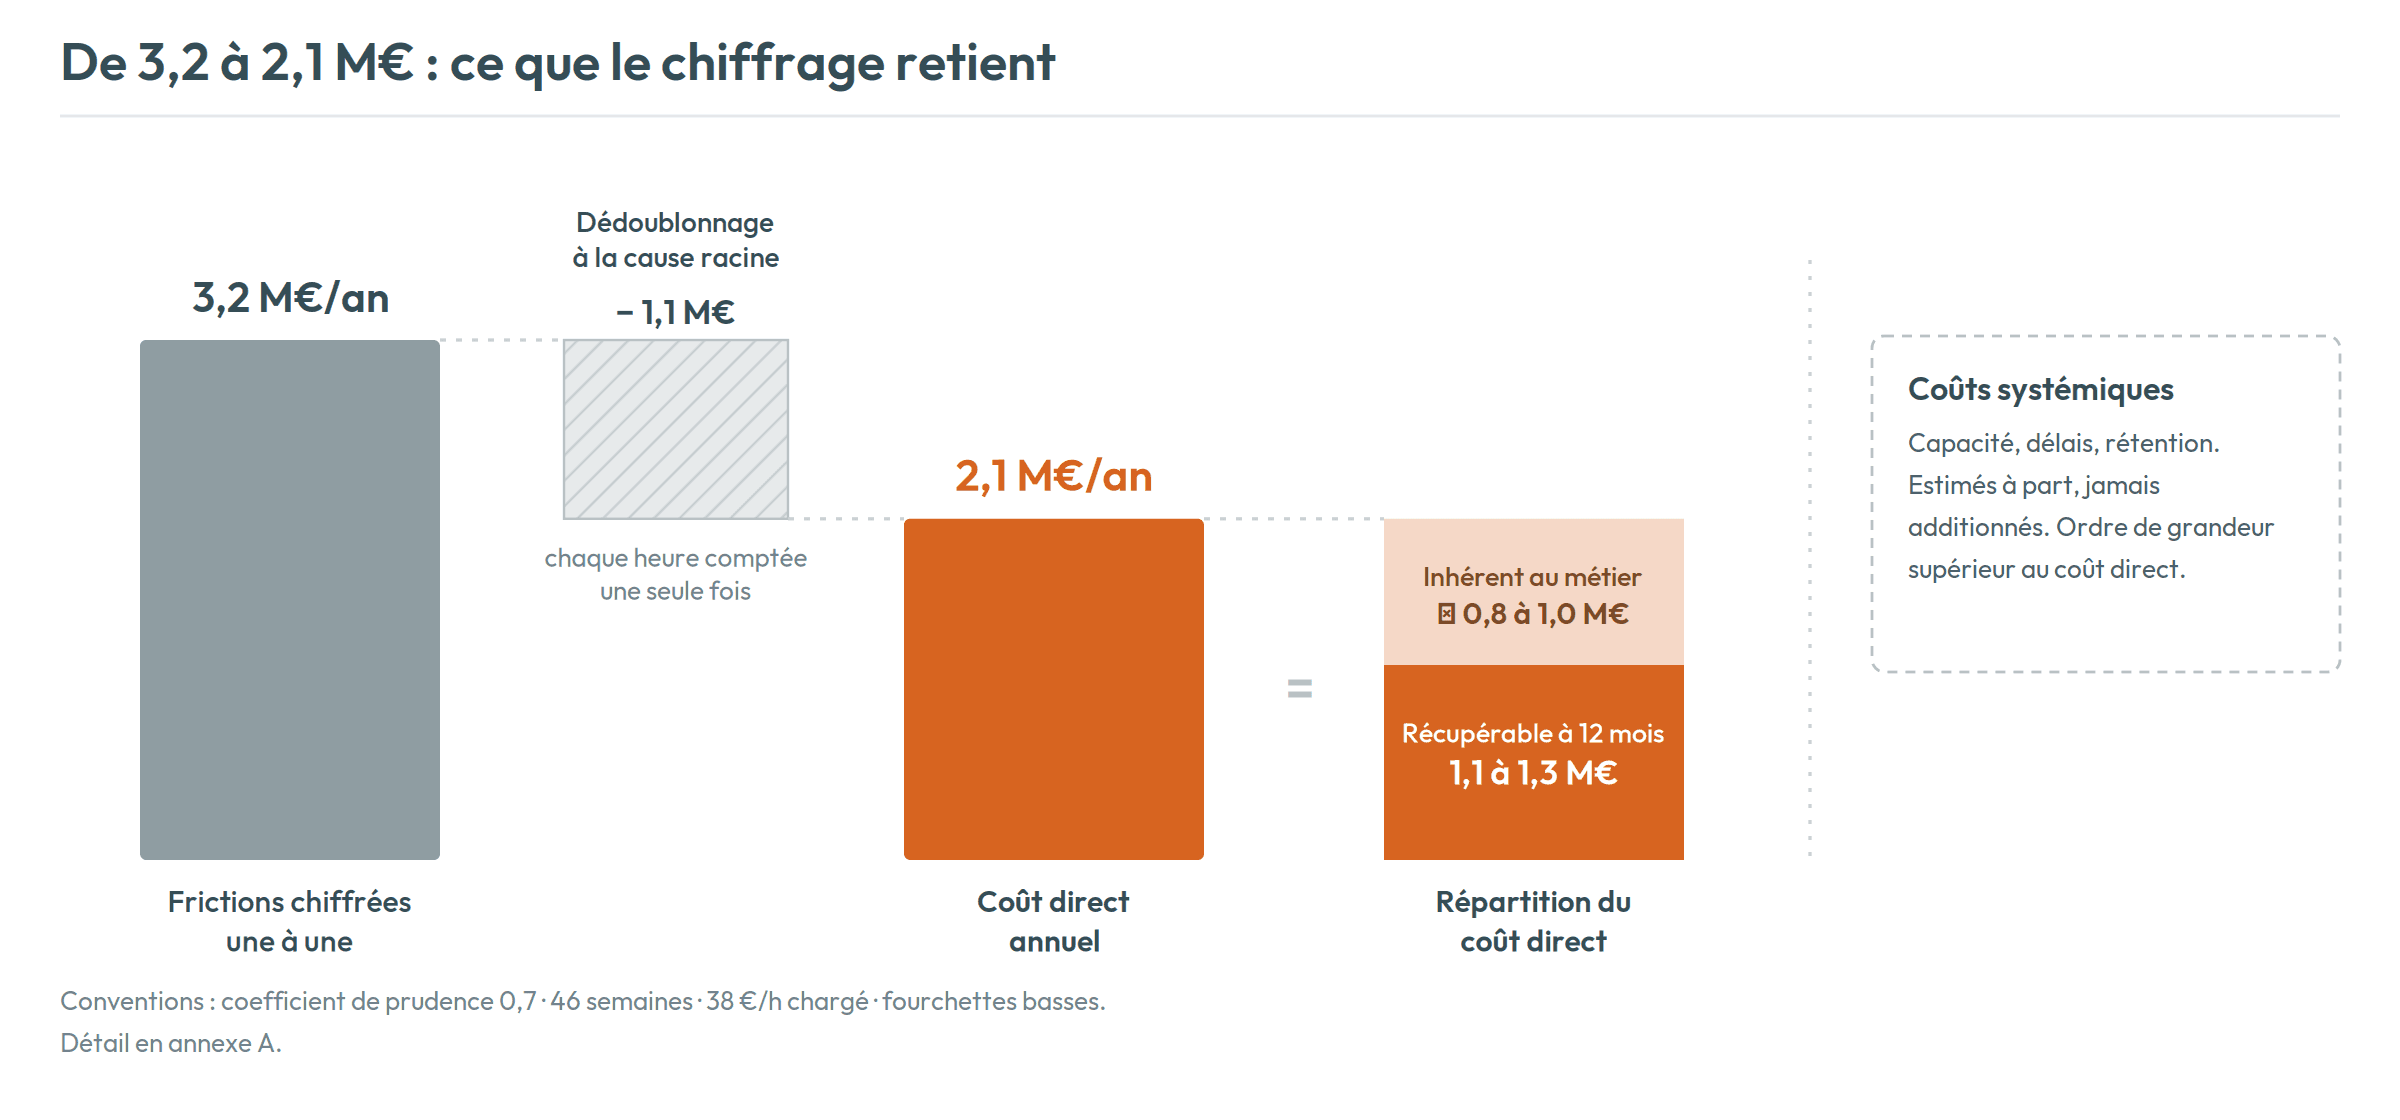
Each amount uses the lower end of its range, after applying a conservative adjustment factor of 0.7 to reported time. Findings are linked to interview quotes; their monetary values rely on the report’s calculation assumptions (appendices B and C).
Assumptions behind the figures: a fully loaded hourly cost of €38, to be confirmed using HR data; every total varies proportionally with this rate. Other assumptions: 46 working weeks; a 0.7 adjustment factor applied to all reported time; extrapolation from 230 interviews to the 251 employees within scope; and the lower end of every range. Wider costs relating to capacity, lead times, retention and overtime are excluded from the totals.
The potential
Of the estimated €2.1m/year in direct costs, the programme targets recoverable potential of €1.1–1.3m/year at the rate reached after 12 months. These gains remain to be verified after implementation. Freed capacity, more reliable lead times and mechanic retention are additional effects excluded from this total.
The three priority workstreams

Give certified mechanics more hands-on time
Documentation searchable in natural language, standard preparation for maintenance checks and parts delivered to the workstation.
≈ €700k, plus restored capacity
Remove the post-inspection quoting bottleneck
Assisted quoting based on inspection findings, with delegated approval thresholds.
≈ €260k, plus freed hangar slots and cash
One shared view of capacity
A shared sales–hangar schedule and an approval rule before any lead-time commitment.
≈ €180k, plus more reliable delivery dates
The rounded gains from the three workstreams total ≈ €1.14m. Section 4.6 of the full report uses ≈ €1.15m, including additional actions in horizons 2 and 3. Both describe the same potential of €1.1–1.3m at 12 months.
The programme targets an annualised gain of €320k/year by week six, €890k/year by month six and €1.15m/year by month 12, against estimated cumulative implementation costs of €490k. These annualised figures describe the expected rate at each milestone, not gains realised during the period. Payback timing will depend on expenditure and the pace of implementation. The assessment and action plan fee is outside this calculation.
The five decisions
1
Treat hands-on maintenance time as the company’s scarce resource
and launch workstream 1 with one owner for maintenance check preparation.
2
Manage quoting as a process, rather than relying on individual expertise
Segment the queue, delegate approval thresholds and record each finding once.
3
Establish one shared view of capacity
No date commitment without planning approval, starting in week 1.
4
Place data and AI decisions under the authority of the airworthiness function
Use the governance described in section 4, with stage 1 beginning in month 2.
5
Choose the first opportunity to prototype within 90 days
from the three opportunities detailed in section 5 of the full report.
Conditions for success
An executive team sponsor who is visible to hangar teams: employees will judge the programme’s seriousness by the seniority of its sponsor.
A published baseline from horizon 1: two weeks of initial measurement covering hands-on time, quote turnaround and differences from promised return dates. Without it, teams’ unrecorded efforts to absorb delays would hide gains just as they currently hide losses.
A short monthly review to resolve difficulties and track indicators: credibility comes from consistency, beyond the launch.
A separate confidential channel for workload and fairness concerns, running alongside the programme but independent of it.
Every finding can be traced to the interview quotes behind it and is costed conservatively. The executive team decides which opportunity to pursue first; the report that follows sets out its scale and sequence.
03 — THE FINDINGS
Twelve findings. Three costed.
All traceable.
Reported friction was grouped into five categories and costed item by item: ≈ €3.2m in gross totals. After removing double counting at root-cause level, the retained direct cost is ≈ €2.1m: each lost hour is counted once. Detailed calculations appear in appendix B of the full report.
No. 1
Confirmation
Certified mechanics’ time is fragmented across documentation, preparation and parts collection
Evidence strength
●●●●●
Priority
●●●●●
Direct cost
≈ €1.25m/year
No. 2
New insight
Post-inspection quoting holds up the process
Evidence strength
●●●●○
Priority
●●●●●
Direct cost
≈ €480k/year
No. 3
Confirmation
Sales and the hangar work from different views of capacity
Evidence strength
●●●●●
Priority
●●●●○
Direct cost
≈ €370k/year
No. 4
Refinement
The cost lies in document workflows, rather than the maintenance management system
Evidence strength
●●●●●
Priority
●●●●○
Direct cost
(included in #1)
No. 5
Confirmation
Parts are not delivered to workstations: each technician collects their own
Evidence strength
●●●●○
Priority
●●●○○
Direct cost
(included in #1)
No. 6
New insight
For some aircraft types, release-to-service certification depends on a small number of licensed staff
Evidence strength
●●●●○
Priority
●●●●○
Direct cost
(systemic)
No. 7
New insight
Teams silently absorb internal delays, keeping them invisible to operators
Evidence strength
●●●●○
Priority
●●●○○
Direct cost
(measurement)
No. 8
Confirmation
The two outlying bases have limited access to information held at the main site
Evidence strength
●●●●○
Priority
●●●○○
Direct cost
(systemic)
No. 9
Confirmation
Onboarding happens on the job: six to nine months before independent working
Evidence strength
●●●●○
Priority
●●●○○
Direct cost
(amplifying factor)
No. 10
Refinement
The aircraft-on-ground (AOG) desk rewards emergency response, never prevention
Evidence strength
●●●○○
Priority
●●●○○
Direct cost
(systemic)
No. 11
New insight
Fault history sits unused in the maintenance management system: stored, but not put to work
Evidence strength
●●●●○
Priority
●●●●○
Direct cost
(opportunity)
No. 12
Confirmation
Monthly sales targets overlook the long cycles of maintenance checks
Evidence strength
●●●○○
Priority
●●○○○
Direct cost
(included in #3)
This classification shows the assessment’s added value finding by finding. A confirmation supports leadership’s intuition and clarifies its operational consequences. A new insight reveals a blind spot: here, the quoting bottleneck and concentration of certification authority, neither of which appeared in the stated priorities. A refinement helps prevent misdirected investment. Finding 4 is the clearest example: replacing the computerised maintenance management system (CMMS) would not give technicians any time back, because the problem lies in the workflow.
Detailed example, finding 2: post-inspection quoting holds up the process
Detailed example, finding 2: post-inspection quoting holds up the process
What teams report. The theme appears in 74 of the 230 interviews, most strongly among sales, estimating and sales administration staff (9 of 17 interviews) and in the technical office. An inspection generates findings, each requiring an additional estimate. The operator waits for the quote before approving the work. But the queue runs through two people: an experienced estimator who alone knows the full pricing schedule, and the sales manager who approves it. Findings move from a technician’s notebook to the CMMS, then to a quoting spreadsheet: the same information entered three times. Meanwhile, the aircraft occupies a bay without productive work.
“The aircraft is ready to be repaired; everyone is waiting for the quote.” (a team leader) “I enter the findings three times: in my notebook, in the CMMS and in the quote.” (an engine technician)
What the figures show. Consolidated direct cost: ≈ €480k/year. Duplicate entry and reconstructing information: ≈ €265k; chasing and coordinating around the queue: ≈ €130k; correcting pricing and reference discrepancies: ≈ €85k. The wider cost is excluded: every day spent quoting ties up a hangar slot—teams report three to six working days for heavy checks—and delays invoicing by the same amount. This lost production, estimated separately, likely exceeds the direct cost. Quantifying it would require billing rates per bay, beyond the interview scope. The full report lists this among the first data to collect.
Why it happens. Quoting concentrates three scarce resources at one point: pricing expertise held by one person, approval authority held by another, and findings that become usable only after re-entry. There is no rule for segmenting the queue: an €800 quote waits behind an €80,000 quote.
How it spreads. Inspection completed → findings re-entered → estimating queue → approval → quote sent to the operator → operator approval awaited → work finally starts. Functions involved: technicians → technical office → estimating → sales → operator → planning. Every step extends the time the slot remains occupied. Finding 3 compounds this: that blocked slot is already needed elsewhere.
What to verify. Median time from finding to quote sent; the share of quotes below a simple threshold, to be defined; and actual bay occupancy while quotes are pending.
The sequence: where to start, what can wait and what is not worth the effort.
Actions follow their operational dependencies.
Fix information inputs before adding tools: a document assistant connected to scattered reference sources would reproduce that disorder. Free up time before selling more: increasing orders against overstated capacity would worsen finding 3. Establish a shared view of capacity before making commitments: every promise based on the old schedule would add to the backlog.
The sequence covers three horizons: short term (horizon 1), medium term and long term. Horizon 1 removes bottlenecks and, crucially, establishes the baseline. Teams’ silent absorption of delays (finding 7) hides internal costs behind good customer indicators. Without a baseline, gains in later horizons would remain invisible.
Financial summary
End of week 6
End of month 6
End of month 12
Expected annual gain at this milestone — conservative estimate
≈ €320k
≈ €890k
≈ €1.15m
Share of direct costs (€2.1m)
~15%
~42%
~55%
Cumulative implementation cost
≈ €40k
≈ €260k
≈ €490k
Evidence level
Supported by evidence
Evidence-supported to inferred
Inferred to hypothetical
Opportunities: what teams identified and what still needs testing.
The 23 commercial signals in the interviews point to three opportunities, presented as hypotheses to test, not confirmed launches. One is detailed here.
Opportunity 1
Test a predictive reliability service.
Two facts underpin the idea: fault histories by aircraft type sit unused in the CMMS (finding 11), and teams report operators effectively saying, “You see our failures before we do: tell us.” The market: regional operators and helicopter operators without large technical teams, for whom an early warning can preserve flying hours. Prerequisites: structured historical data (stage 3 of the AI roadmap) and a contractual framework for data ownership. First step: a 90-day pilot with two willing operators, covering one aircraft type, without a pricing commitment.
This could turn technical history into a new service, subject to validating the available data and customer interest.
Opportunity 2
A maintenance academy.
Train mechanics for the company and for operators struggling to recruit, drawing on existing approvals.
Opportunity 3
A flight-hour-based contract.
Make smaller operators’ bills more predictable in exchange for a multi-year commitment: the budget visibility they seek and the workload visibility the hangar needs.
04 — AUTOMATION
What AI can take on,
activity by activity.
Why address organisation before AI?
The document assistant and assisted quoting require consolidated reference material, findings recorded once and standardised preparation. With these foundations, AI can search, compile and prefill reliable information.
Gains from stages 1 and 2 are already included in the programme totals. Stage 3 depends on the data and is excluded from the totals shown.
The three stages
Stage
Scope
Timing
Investment
Annual gain (conservative / realistic)
1 · The document assistant
Natural-language queries across manuals, instructions and bulletins, with exact source references; preparation of maintenance check files; assisted quoting from inspection findings
Months 2–4
€60–90k
€380k / €520k
2 · The diagnostic copilot
Suggestions based on historical findings by aircraft type; sorting and prioritising aircraft-on-ground requests; support for complex estimates
Months 4–9
€80–120k
€180k / €280k
3 · Predictive capabilities
Parts demand forecasting; predictive reliability for the supported fleet; hangar slot optimisation
Months 9–15
€100–150k
Dependent on data: hypothesis to validate
05 — WHAT THIS MEANS FOR YOU
What you would receive,
for your situation.
Lead-to-cash process
From first contact to payment: identify what consumes selling time and prioritise actions.
Operational action plan
Across a company, division or several sites: understand bottlenecks and build a plan with estimated costs and benefits.
AI adoption
Identify activities to transform, prioritise AI uses and organise deployment.
LET’S TALK
An initial conversation with a partner
What decision would you like to make with greater clarity?
In a 30-minute conversation with a partner, we can clarify your challenge, the teams involved and what this approach could offer you.
Leave your contact details to arrange an initial conversation.
Prefer email? Write to us here
or get in touch on social media.
LET’S TALK
An initial conversation with a partner
What decision would you like to make with greater clarity?
In a 30-minute conversation with a partner, we can clarify your challenge, the teams involved and what this approach could offer you.
Leave your contact details to arrange an initial conversation.
Prefer email? Write to us here
or get in touch on social media.
LET’S TALK
An initial conversation with a partner
What decision would you like to make with greater clarity?
In a 30-minute conversation with a partner, we can clarify your challenge, the teams involved and what this approach could offer you.
Leave your contact details to arrange an initial conversation.
Prefer email? Write to us here
or get in touch on social media.
